
The American housing market has undergone a dramatic transformation since 2020. After years of soaring prices, record-low inventory, and mortgage rates that climbed from historic lows of 2.65% in January 2021 to nearly 7% in 2025, homebuyers face a vastly different landscape than just a few years ago.
The good news? Housing affordability is showing signs of improvement in 2026. According to Zillow’s latest forecast, homes should become affordable in 20 major markets by year’s end—the most since 2022. Rising incomes, subdued price growth, and gradually easing mortgage rates are helping buyers regain their footing.
But affordability varies wildly depending on where you live. Our analysis of housing data across America reveals that the most affordable markets remain concentrated in the Midwest and South, while California cities continue to dominate the least affordable list—though Miami has emerged as the single most cost-burdened city in the nation.
Our team at RefiGuide.org analyzed income and housing price data for cities across the country to identify the best and worst places for homebuyers in 2026. Whether you’re looking to relocate for better affordability or simply curious about where your city ranks, this report has the answers.
Key Findings
- Most Affordable City: Flint, MI — where median income exceeds the typical home price
- Least Affordable City: Miami, FL — where 36% of household income goes to housing costs
- Regional Pattern: 9 of the top 10 most affordable cities are in the Midwest
- California Dominates: 7 of the 10 least affordable cities are in California
- National Average: Americans spend 21% of income on housing — but 47 of 50 largest cities exceed this
(Income exceeds home price)
(Least affordable by price)
(January 2026)
(30-year fixed)
Methodology: How We Measured Affordability
Our Approach
To measure housing affordability, we compared two key metrics: median household income and median home price. The result is an affordability score that shows what percentage of a typical home’s price could be covered by one year of median income in that area.
Higher scores = more affordable. A score of 100% means one year’s income equals the home price. A score of 50% means two years’ income would be needed. Most cities score between 15-35%.
Data Sources:
- Income Data: U.S. Census Bureau American Community Survey (2023-2024)
- Home Prices: Zillow Home Value Index (January 2026)
The 25 Most Affordable Places to Buy a Home in 2026
The most affordable housing markets in America share common characteristics: they’re predominantly located in the Midwest and South, often in cities that experienced population decline or economic transitions over the past few decades. While these markets offer exceptional value, buyers should also consider factors like job markets, amenities, and long-term growth potential.
Flint, Michigan tops our list with an extraordinary affordability score—the median household income actually exceeds the typical home price. At just $61 per square foot (compared to over $1,000 in the least affordable markets), Flint offers perhaps the most accessible path to homeownership in America. The city’s water system has now met EPA standards for six consecutive years, and revitalization efforts are underway.
Detroit, Michigan follows closely, with home prices roughly twice the median income—still remarkably affordable by national standards. With 22% of housing vacant, it’s firmly a buyer’s market, and neighborhoods are seeing renewed investment.
List of 25 Most Affordable Cities
Affordability Score: Median Income as % of Home Price (Higher = More Affordable)
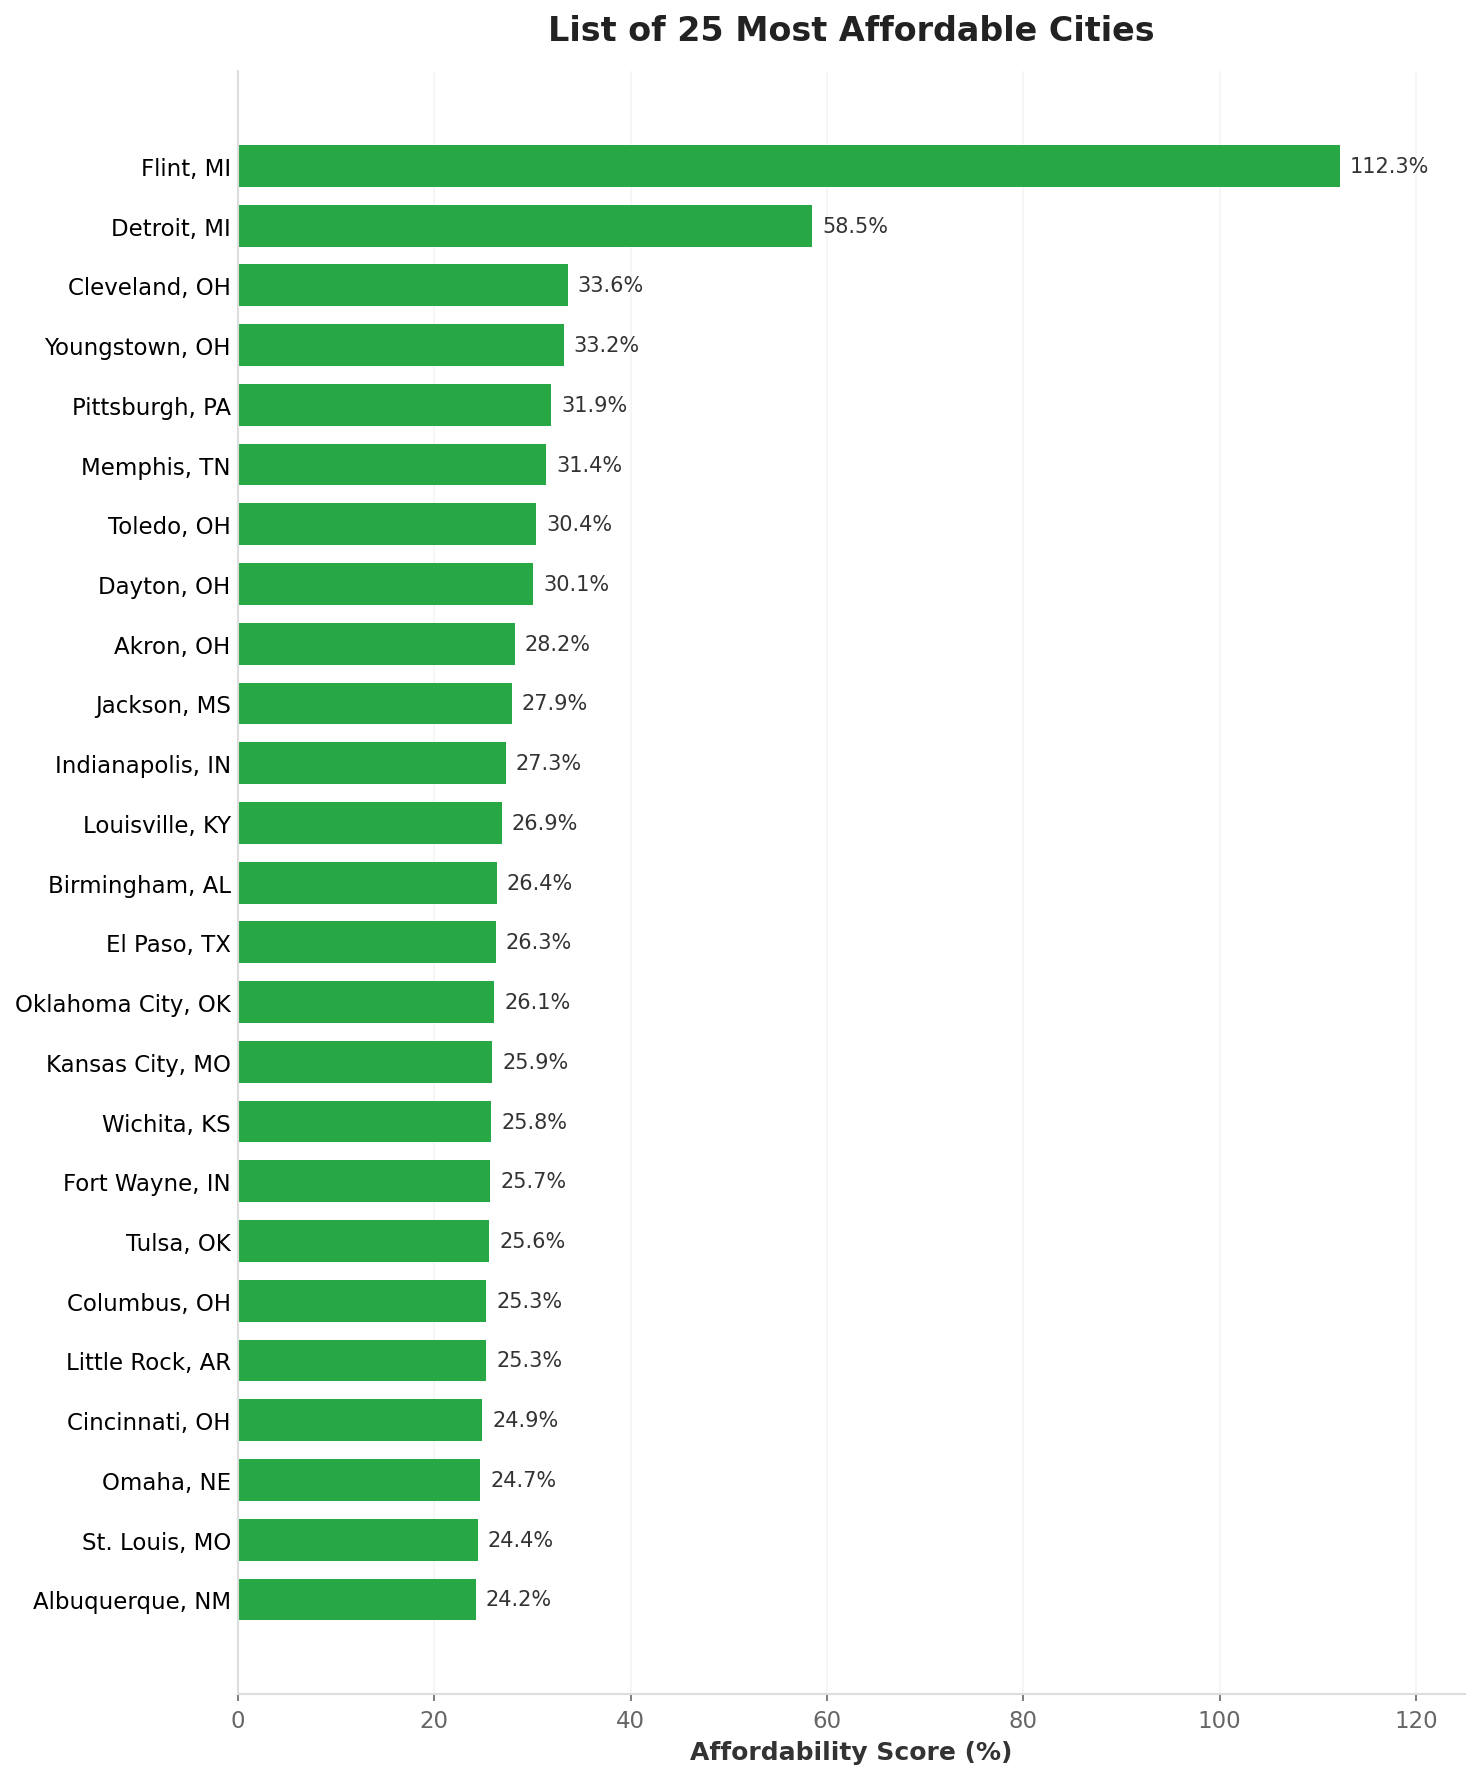
Source: U.S. Census Bureau ACS 2024, Zillow ZHVI January 2026
| Rank | City | State | Median Income | Median Home Price | Affordability Score |
|---|---|---|---|---|---|
| 1 | Flint | MI | $32,000 | $28,500 | 112.3% |
| 2 | Detroit | MI | $39,200 | $67,000 | 58.5% |
| 3 | Cleveland | OH | $35,300 | $105,000 | 33.6% |
| 4 | Youngstown | OH | $31,500 | $95,000 | 33.2% |
| 5 | Pittsburgh | PA | $59,000 | $185,000 | 31.9% |
| 6 | Memphis | TN | $52,700 | $168,000 | 31.4% |
| 7 | Toledo | OH | $42,000 | $138,000 | 30.4% |
| 8 | Dayton | OH | $38,500 | $128,000 | 30.1% |
| 9 | Akron | OH | $44,500 | $158,000 | 28.2% |
| 10 | Jackson | MS | $41,800 | $150,000 | 27.9% |
| 11 | Indianapolis | IN | $66,900 | $245,000 | 27.3% |
| 12 | Louisville | KY | $67,250 | $250,000 | 26.9% |
| 13 | Birmingham | AL | $42,800 | $162,000 | 26.4% |
| 14 | El Paso | TX | $59,900 | $228,000 | 26.3% |
| 15 | Oklahoma City | OK | $70,000 | $268,000 | 26.1% |
| 16 | Kansas City | MO | $70,000 | $270,000 | 25.9% |
| 17 | Wichita | KS | $58,000 | $225,000 | 25.8% |
| 18 | Fort Wayne | IN | $56,500 | $220,000 | 25.7% |
| 19 | Tulsa | OK | $60,900 | $238,000 | 25.6% |
| 20 | Columbus | OH | $67,100 | $265,000 | 25.3% |
| 21 | Little Rock | AR | $55,200 | $218,000 | 25.3% |
| 22 | Cincinnati | OH | $56,800 | $228,000 | 24.9% |
| 23 | Omaha | NE | $71,600 | $290,000 | 24.7% |
| 24 | St. Louis | MO | $55,000 | $225,000 | 24.4% |
| 25 | Albuquerque | NM | $71,500 | $295,000 | 24.2% |
Notice the pattern: Ohio alone has six cities in the top 25 most affordable. The Rust Belt, once associated with economic decline, now offers some of America’s best housing value. Michigan, Ohio, Indiana, and Kentucky provide accessible homeownership that’s increasingly rare in coastal markets.
The South is also well-represented, with cities like Memphis, Jackson, Birmingham, and Little Rock offering strong affordability. Texas appears with El Paso, while the Great Plains region shows up through Kansas City, Wichita, Oklahoma City, Tulsa, and Omaha.
Fair Use Statement
Information is power. Please share our content for editorial or discussion purposes. All we ask is that you link back to this page and give proper credit to RefiGuide.org.
The 25 Least Affordable Places to Buy a Home in 2026
At the opposite end of the spectrum, the least affordable markets present a stark contrast. In these cities, homeownership remains out of reach for typical households—sometimes requiring 20 or more years of income to equal the price of a median home.
Miami, Florida has emerged as the least affordable city when measuring housing burden as a percentage of income. With 36% of median household income going to housing costs and two-thirds of households renting, Miami’s affordability crisis has deepened even as homeowner costs slightly declined. Rising rents are the primary culprit.
Newport Beach and Santa Monica, California remain the least affordable by raw price-to-income ratio. In Newport Beach, the typical home costs more than 25 times the median household income—meaning it would take a quarter century of income (before taxes and expenses) to equal the purchase price.
List of 25 Least Affordable Cities
Affordability Score: Median Income as % of Home Price (Lower = Less Affordable)
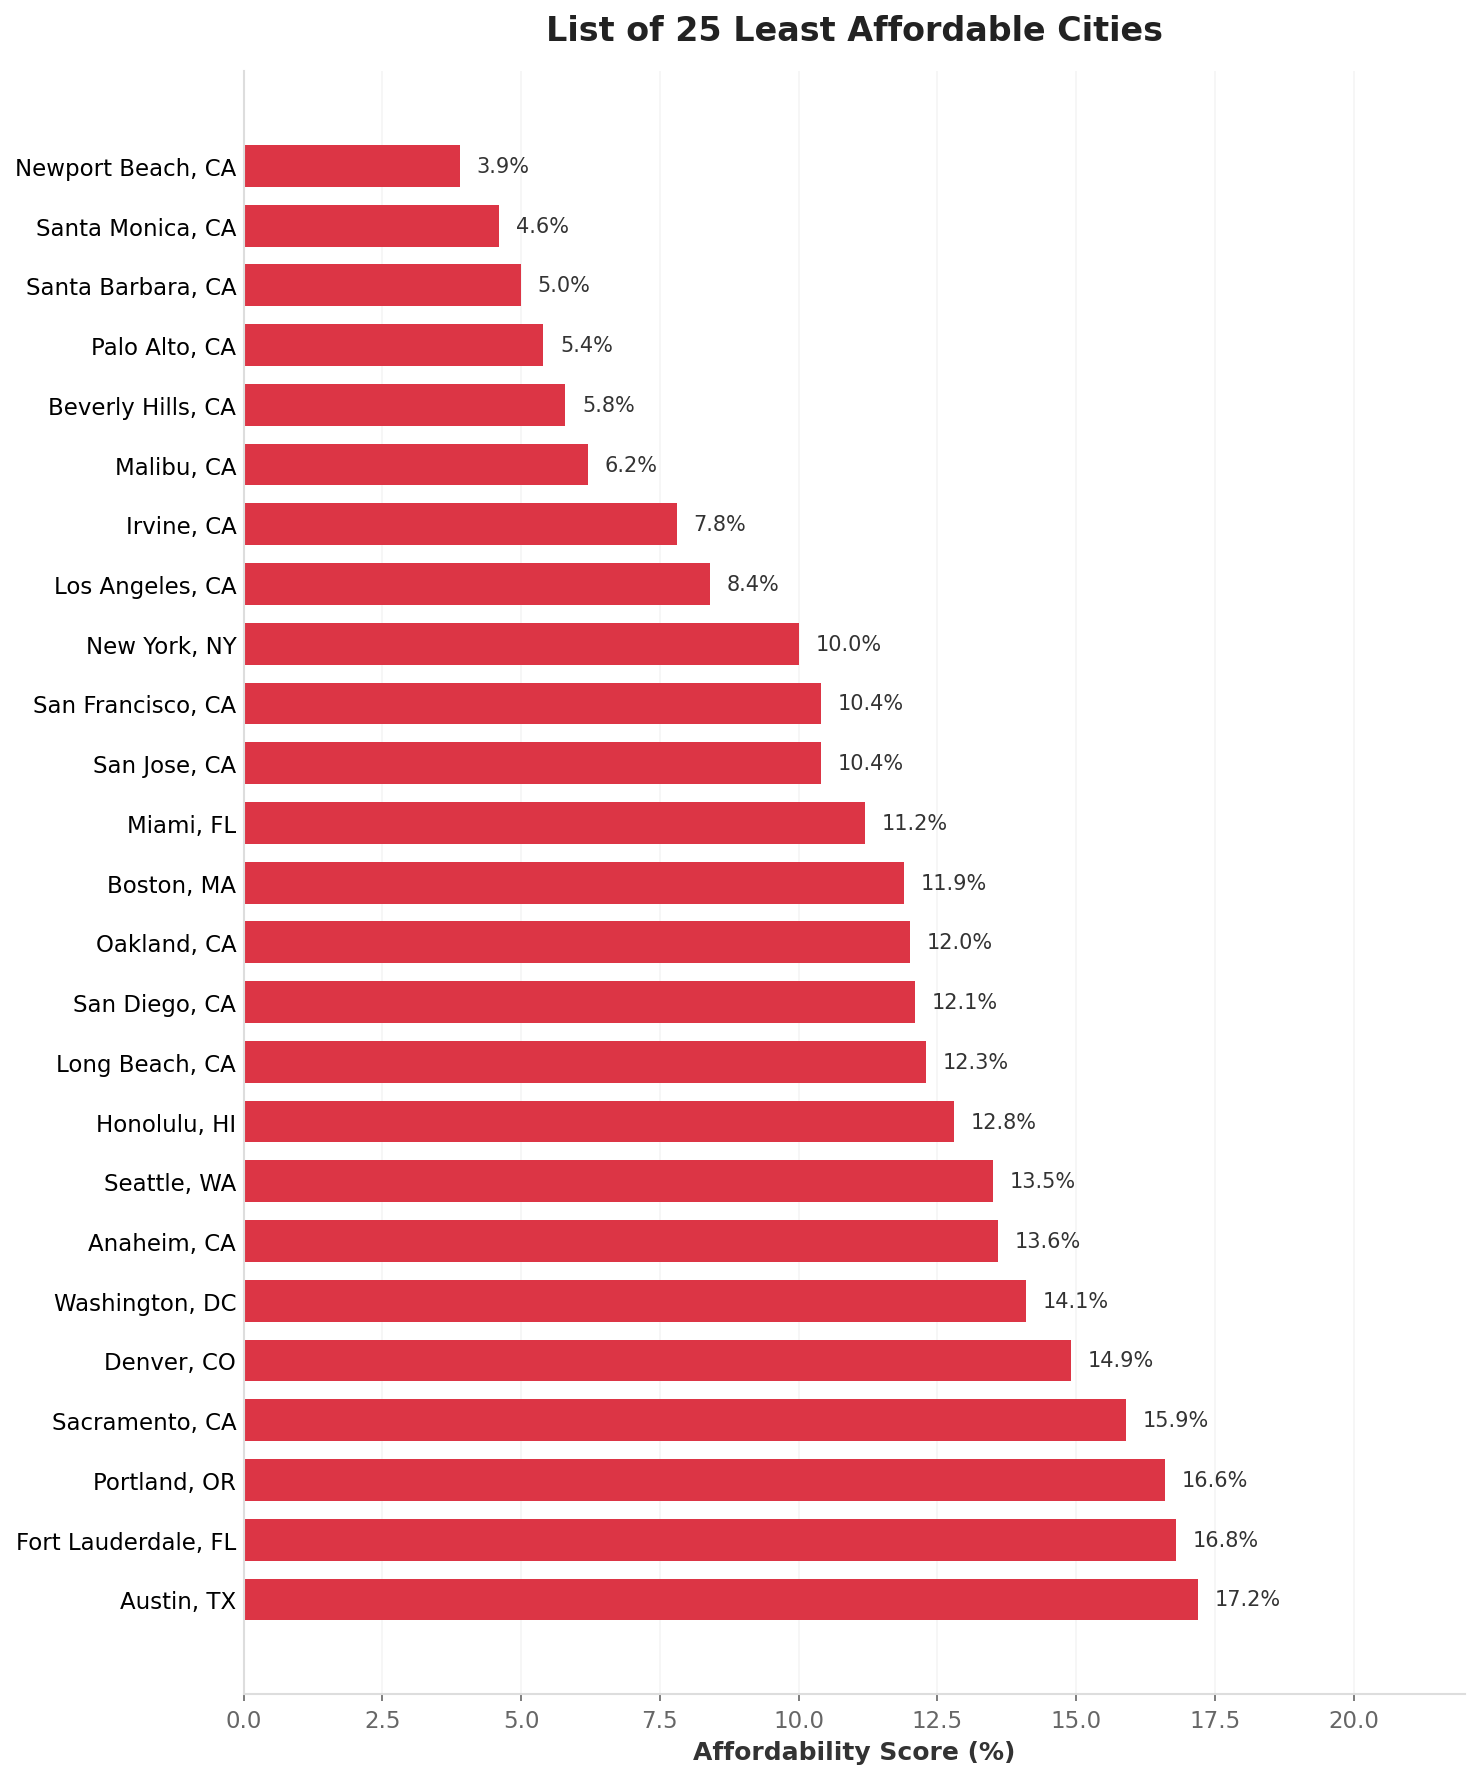
Source: U.S. Census Bureau ACS 2024, Zillow ZHVI January 2026
| Rank | City | State | Median Income | Median Home Price | Affordability Score |
|---|---|---|---|---|---|
| 1 | Newport Beach | CA | $127,000 | $3,250,000 | 3.9% |
| 2 | Santa Monica | CA | $98,500 | $2,150,000 | 4.6% |
| 3 | Santa Barbara | CA | $82,000 | $1,650,000 | 5.0% |
| 4 | Palo Alto | CA | $188,000 | $3,500,000 | 5.4% |
| 5 | Beverly Hills | CA | $114,000 | $1,950,000 | 5.8% |
| 6 | Malibu | CA | $148,000 | $2,400,000 | 6.2% |
| 7 | Irvine | CA | $115,000 | $1,480,000 | 7.8% |
| 8 | Los Angeles | CA | $82,300 | $975,000 | 8.4% |
| 9 | New York | NY | $81,200 | $809,000 | 10.0% |
| 10 | San Francisco | CA | $139,800 | $1,350,000 | 10.4% |
| 11 | San Jose | CA | $148,200 | $1,420,000 | 10.4% |
| 12 | Miami | FL | $66,300 | $590,000 | 11.2% |
| 13 | Boston | MA | $97,800 | $825,000 | 11.9% |
| 14 | Oakland | CA | $102,200 | $850,000 | 12.0% |
| 15 | San Diego | CA | $111,000 | $920,000 | 12.1% |
| 16 | Long Beach | CA | $91,300 | $745,000 | 12.3% |
| 17 | Honolulu | HI | $92,600 | $725,000 | 12.8% |
| 18 | Seattle | WA | $118,700 | $880,000 | 13.5% |
| 19 | Anaheim | CA | $88,500 | $650,000 | 13.6% |
| 20 | Washington | DC | $109,700 | $780,000 | 14.1% |
| 21 | Denver | CO | $92,500 | $620,000 | 14.9% |
| 22 | Sacramento | CA | $91,400 | $575,000 | 15.9% |
| 23 | Portland | OR | $91,500 | $550,000 | 16.6% |
| 24 | Fort Lauderdale | FL | $68,200 | $405,000 | 16.8% |
| 25 | Austin | TX | $90,400 | $525,000 | 17.2% |
California’s dominance of the least affordable list is overwhelming: 14 of the 25 least affordable cities are in California. The state’s combination of limited housing supply, strong job markets (particularly in tech), and restrictive land-use policies continues to make homeownership exceptionally challenging for middle-income households.
Florida now claims two spots with Miami and Fort Lauderdale, driven largely by rising insurance costs and an influx of remote workers from expensive markets. Austin, Texas—once celebrated for affordability—has joined the list after years of rapid price appreciation.
Housing Affordability by State
Looking at affordability patterns across entire states reveals clear regional divides. The South and Midwest offer the most accessible housing markets, while the West Coast and Northeast present the greatest challenges.
Most Affordable States for Homebuyers
Average Affordability Score Across Major Cities (Higher = More Affordable)
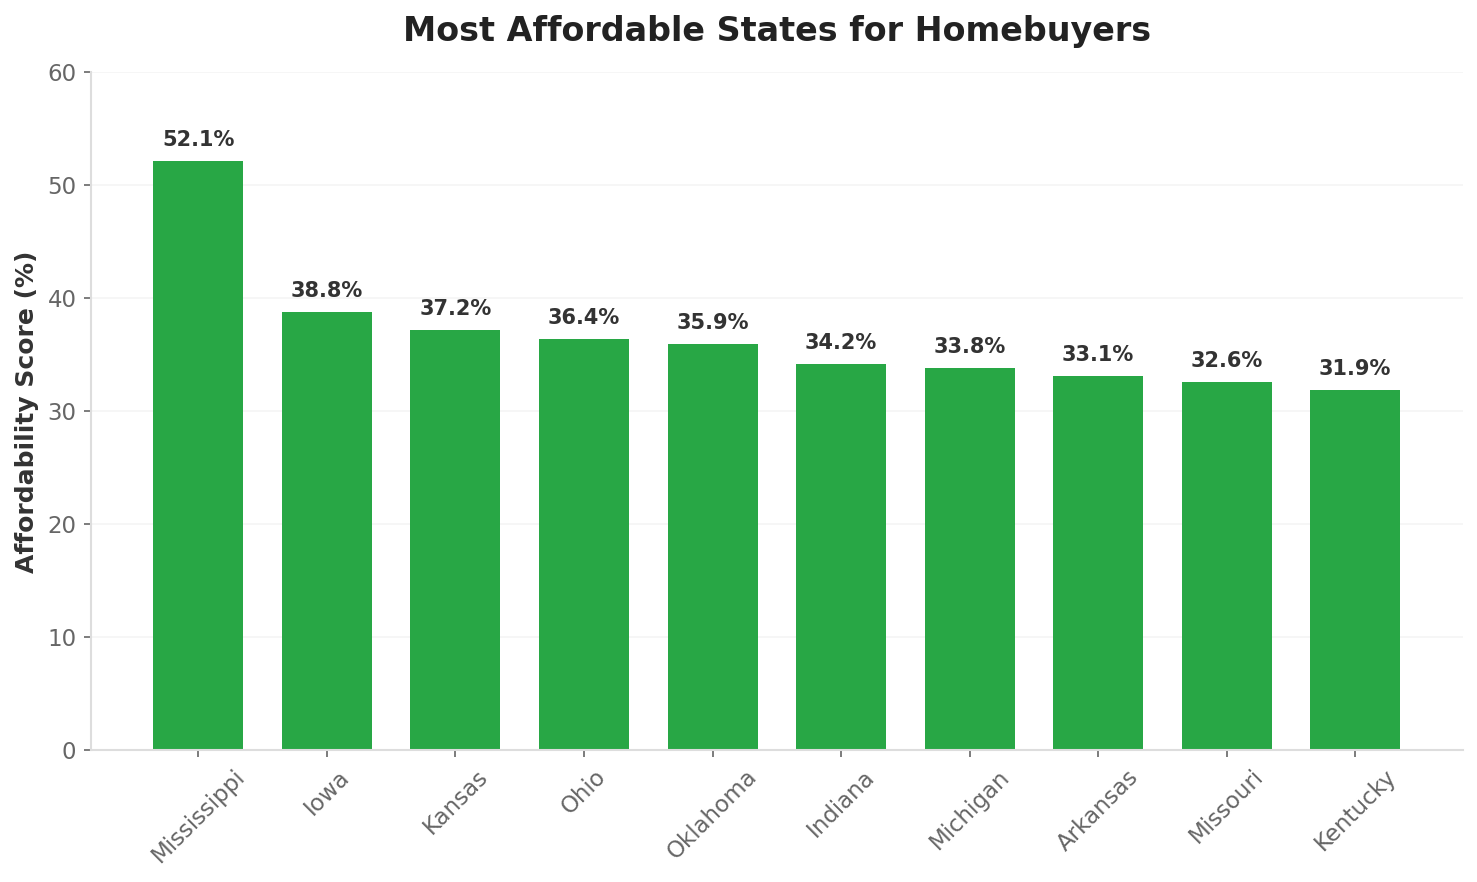
Source: Analysis of major metropolitan areas in each state
Mississippi leads as the most affordable state, with a price-to-income ratio of just 3.0—meaning homes cost roughly three times the typical annual income. The state offers remarkably low entry points for homeownership, with median home prices under $180,000 in most markets. While job growth has been modest, remote work opportunities have made Mississippi increasingly attractive for buyers priced out of expensive metros.
Iowa, Kansas, and Ohio follow closely, all with ratios under 3.5. These states benefit from stable, diversified economies anchored by agriculture, manufacturing, healthcare, and education sectors. Des Moines, Wichita, and Columbus have emerged as regional hubs offering both affordability and career opportunities—a rare combination in today’s market. Ohio in particular stands out with six cities in our top 25 most affordable list.
Oklahoma and Indiana round out the top tier of affordable states. Oklahoma City and Indianapolis both offer median home prices well under $300,000, combined with growing job markets in energy, logistics, and technology. Indiana’s central location and low cost of living have attracted significant corporate investment in recent years.
Michigan, Arkansas, Missouri, and Kentucky complete the top ten most affordable states. Detroit’s ongoing revitalization, combined with extremely low home prices, makes Michigan particularly appealing for investors and first-time buyers willing to bet on continued recovery. Louisville and Kansas City straddle state borders but offer affordable options on both sides.
Conversely, Hawaii (ratio of 8.8) and California (8.2) remain the least affordable states by a wide margin. In Hawaii, geographic isolation, limited land, and strong demand from mainland buyers and investors have pushed prices far beyond local incomes. California’s combination of restrictive zoning, strong job markets, and desirable climate continues to make homeownership a struggle for middle-income families.
Massachusetts, Washington, and Colorado also rank among the least affordable states, with price-to-income ratios above 5.5. Boston’s constrained housing supply, Seattle’s tech-driven demand, and Denver’s pandemic-era boom have all pushed these markets well beyond national norms.
Notably, states like Montana and Idaho—once affordable havens for those fleeing expensive coastal markets—have seen their ratios climb above 6.0 after experiencing 56%+ price increases since 2020. Boise and Missoula, in particular, have transformed from budget-friendly alternatives to increasingly unaffordable markets, as remote workers brought coastal salaries to areas with limited housing supply. This pattern serves as a cautionary tale: today’s affordable markets can quickly become tomorrow’s expensive ones when migration patterns shift.
2026 Housing Market Forecast
What should homebuyers expect in 2026? Several factors are converging to gradually improve affordability—though it remains a long road back to pre-pandemic norms.
Positive Signs
- Mortgage rates easing: Rates are expected to settle near 6% by year-end, down from peaks above 7%
- Income growth outpacing prices: Wages continue rising while home price appreciation slows to 1-2% nationally
- Inventory recovering: Housing inventory rose 26% year-over-year in mid-2025, reaching the highest levels since 2017
- More markets becoming affordable: 20 major metros expected to cross the affordability threshold in 2026
Challenges Remaining
- Insurance costs rising: Property insurance premiums continue climbing, particularly in Florida and California
- Property taxes: Many states have seen significant property tax increases
- Supply constraints: New construction still below historical averages in many markets
- Regional imbalances: Affordable markets often lack job opportunities; job centers remain expensive
For buyers considering a move for affordability reasons, the data suggests targeting Midwest cities with stable or growing job markets—places like Indianapolis, Columbus, Kansas City, and Louisville offer reasonable affordability combined with economic opportunity.
Tips for Homebuyers in 2026
Based on our analysis, here are recommendations for prospective homebuyers:
1. Consider geographic arbitrage. Remote work has made it possible for many workers to live in affordable markets while earning salaries from expensive ones. Cities like Pittsburgh, Indianapolis, and Louisville offer major city amenities at a fraction of coastal prices.
2. Look beyond the sticker price. Factor in property taxes, insurance costs, and HOA fees. A home in Texas may have no state income tax but high property taxes. Florida’s insurance crisis has added thousands to annual costs.
3. Don’t overlook up-and-coming neighborhoods. Cities like Detroit and Cleveland have pockets of significant revitalization. Early buyers in recovering areas can benefit from appreciation while enjoying low entry costs.
4. Get pre-approved and move quickly in affordable markets. The best-priced homes in desirable affordable markets often sell fast. Having financing lined up gives you a competitive advantage.
5. Explore first-time buyer programs. Many states and cities offer down payment assistance, favorable loan terms, or tax credits for first-time buyers. These can significantly improve affordability.
Conclusion
Housing affordability in America remains a tale of two countries. In the Midwest and parts of the South, homeownership is accessible to working and middle-class families—sometimes remarkably so. In California, the major coastal cities, and increasingly markets like Miami, owning a home requires incomes far above the median.
The good news: 2026 appears to be a year of modest improvement. Gradually falling mortgage rates, rising incomes, and increasing inventory are slowly shifting the balance in buyers’ favor. For those willing to consider relocation, exceptional value exists in markets often overlooked by coastal transplants.
Whether you’re a first-time buyer looking for your entry point or a current homeowner considering whether to tap your equity, understanding local affordability conditions is crucial. Use the data in this report to inform your decision.
Fair Use Statement
Information is power. Please share our content for editorial or discussion purposes. All we ask is that you link back to this page and give proper credit to RefiGuide.org.