

Published on January 20th, 2026 by Refiguide.org. Reviewed by Peter G. Miller
The American housing market in 2026 continues to present significant affordability challenges for prospective homebuyers, though some markets offer substantially more opportunity than others. Our comprehensive analysis of housing markets across the United States reveals dramatic disparities in affordability between regions, with the most affordable markets concentrated in the South and Midwest, while coastal California cities dominate the list of least affordable locations.
National Median Home Price
December 2025
National Median Income
2024 Data
National Affordability Rate
Income as % of Home Price
The State of Housing Affordability in 2026
As we enter 2025, the housing market has evolved significantly from the pandemic-era dynamics of 2020. While mortgage rates have moderated from their 2023 peaks, home prices have remained elevated, creating persistent affordability challenges. The national median home price of $428,071 combined with a median household income of $83,730 means that for the typical American household, annual income covers less than 20% of home purchase prices.
However, location matters enormously. Regional disparities in housing affordability have widened, with some Rust Belt and Southern cities offering remarkable value while coastal markets—particularly in California—have become increasingly out of reach for middle-income families.
What’s Changed Since 2020?
- Home Prices: National median home prices increased from approximately $295,000 in mid-2020 to $428,071 in December 2025—a 45% increase
- Interest Rates: Mortgage rates rose from historic lows near 3% to peaks above 7% in 2023, now moderating to around 6.2%
- Income Growth: Median household income grew from $67,521 in 2020 to $83,730 in 2024—a 24% increase that hasn’t kept pace with housing costs
- Remote Work Impact: Continued remote and hybrid work arrangements have allowed more buyers to consider affordable secondary markets
Methodology
Data Sources and Approach:
This analysis examines housing affordability across major U.S. cities by comparing two fundamental metrics: median household income and median home prices. Our affordability rate is calculated as the percentage of a home’s purchase price that could be covered by one year of median household income.
- Home Price Data: Median home values from Zillow Research, Redfin, and NAR (National Association of Realtors) for late 2024/early 2025
- Income Data: Median household income from U.S. Census Bureau 2024 American Community Survey and Current Population Survey
- Affordability Calculation: (Median Household Income ÷ Median Home Price) × 100
- Geographic Coverage: Analysis includes the 100+ largest cities and metropolitan areas across all 50 states
Note: This methodology provides a snapshot of relative affordability and does not account for factors such as mortgage rates, down payment requirements, property taxes, or individual financial circumstances. A higher affordability rate indicates that housing is more accessible relative to local incomes.
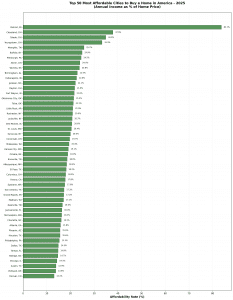
Most Affordable Cities to Buy a Home in 2026
The most affordable housing markets in America remain predominantly located in the Midwest and South, where combination of lower home prices and reasonable incomes create exceptional value for homebuyers. These cities offer not just affordability, but also growing job markets, lower costs of living, and strong community foundations.
Chart: Top 50 Most Affordable Cities showing annual income as percentage of home price
Top 10 Most Affordable Cities
| Rank | City | Median Income | Median Home Price | Affordability Rate |
|---|---|---|---|---|
| 1 | Detroit, MI | $36,000 | $43,000 | 83.7% |
| 2 | Cleveland, OH | $36,000 | $95,000 | 37.9% |
| 3 | Toledo, OH | $44,000 | $126,000 | 34.9% |
| 4 | Youngstown, OH | $35,000 | $105,000 | 33.3% |
| 5 | Memphis, TN | $45,000 | $175,000 | 25.7% |
| 6 | Buffalo, NY | $46,000 | $185,000 | 24.9% |
| 7 | Pittsburgh, PA | $54,000 | $220,000 | 24.5% |
| 8 | Akron, OH | $42,000 | $175,000 | 24.0% |
| 9 | Wichita, KS | $56,000 | $235,000 | 23.8% |
| 10 | Birmingham, AL | $48,000 | $210,000 | 22.9% |
Why These Markets Are Affordable
Several factors contribute to the exceptional affordability in these regions:
- Abundant Land: Unlike coastal areas, these regions have ample space for development, keeping supply healthy
- Lower Cost of Living: Overall expenses including taxes, utilities, and goods are typically 10-30% below national averages
- Economic Diversification: Cities like Pittsburgh and Nashville have successfully transitioned from manufacturing to healthcare, education, and tech
- Population Stability: Moderate demand pressure compared to high-growth Sun Belt and coastal markets
- Remote Work Opportunity: These markets increasingly attract remote workers seeking affordability without sacrificing urban amenities
Least Affordable Cities to Buy a Home in 2025
On the opposite end of the spectrum, California continues to dominate the list of least affordable housing markets. High demand, limited supply due to geographic constraints and restrictive zoning, and strong job markets have pushed home prices far beyond what even high local incomes can reasonably support.

Chart: Top 50 Least Affordable Cities showing annual income as percentage of home price
Top 10 Least Affordable Cities
| Rank | City | Median Income | Median Home Price | Affordability Rate |
|---|---|---|---|---|
| 1 | Newport Beach, CA | $130,000 | $2,300,000 | 5.7% |
| 2 | Santa Monica, CA | $100,000 | $1,800,000 | 5.6% |
| 3 | Manhattan Beach, CA | $155,000 | $2,650,000 | 5.8% |
| 4 | Palo Alto, CA | $165,000 | $2,800,000 | 5.9% |
| 5 | Los Altos, CA | $208,000 | $3,200,000 | 6.5% |
| 6 | Cupertino, CA | $172,000 | $2,500,000 | 6.9% |
| 7 | Saratoga, CA | $185,000 | $2,700,000 | 6.9% |
| 8 | Laguna Beach, CA | $112,000 | $1,550,000 | 7.2% |
| 9 | Berkeley, CA | $87,000 | $1,205,000 | 7.2% |
| 10 | San Carlos, CA | $168,000 | $2,200,000 | 7.6% |
State-by-State Affordability Rankings
Examining affordability at the state level reveals clear regional patterns. Southern and Midwestern states consistently offer the best affordability, while Western and Northeastern states present significant challenges for homebuyers.

Chart: State affordability rates color-coded by region (Green = South, Blue = Midwest, Red = West, Orange = Northeast)
Most Affordable States
- Mississippi – 28.5% affordability rate
- West Virginia – 27.8% affordability rate
- Ohio – 26.2% affordability rate
- Arkansas – 24.5% affordability rate
- Oklahoma – 24.0% affordability rate
Least Affordable States
- Hawaii – 6.5% affordability rate
- California – 7.8% affordability rate
- Washington DC – 6.2% affordability rate
- Wyoming – 10.2% affordability rate
- Utah – 10.5% affordability rate
All 12 of the most affordable states are located in the South or Midwest. These regions offer combinations of lower home prices, moderate cost of living, and reasonable income levels that make homeownership accessible to middle-class families.
Major Metropolitan Markets Analysis
For many Americans, job opportunities in major metropolitan areas are essential considerations alongside affordability. Our analysis of the 50 largest housing markets shows that some major cities still offer reasonable affordability while others have become increasingly inaccessible.
Chart: Major metropolitan markets color-coded by affordability level
Most Affordable Major Markets (Population 250,000+)
- Detroit, MI – 83.7% (Median home: $43,000)
- Cleveland, OH – 37.9% (Median home: $95,000)
- Memphis, TN – 25.7% (Median home: $175,000)
- Buffalo, NY – 24.9% (Median home: $185,000)
- Pittsburgh, PA – 24.5% (Median home: $220,000)
Least Affordable Major Markets
- San Jose, CA – 9.1% (Median home: $1,626,000)
- San Francisco, CA – 11.8% (Median home: $1,181,000)
- Los Angeles, CA – 8.2% (Median home: $925,000)
- San Diego, CA – 9.9% (Median home: $895,000)
- Miami, FL – 8.8% (Median home: $565,000)
Key Trends and Insights for 2025
1. The Persistence of Regional Divides
The gap between America’s most and least affordable markets has widened since our 2020 analysis. While home prices have risen nationwide, the increases have been most dramatic in already-expensive markets, particularly in California and mountain West states that saw significant pandemic-era migration.
2. Midwest and Rust Belt Revival
Cities like Detroit, Cleveland, and Pittsburgh have emerged as surprisingly attractive options for remote workers and young professionals. These markets offer:
- Affordable housing (often under $250,000 for quality homes)
- Revitalized downtown areas with cultural amenities
- Growing tech and healthcare sectors
- Short commute times and low traffic
- Strong educational institutions
3. California’s Affordability Challenge
California continues to face a severe housing affordability crisis. Despite high incomes in tech-heavy regions, housing costs have far outpaced wage growth. This has led to:
- Continued out-migration to neighboring states like Nevada, Arizona, and Texas
- Multi-generational households becoming more common
- Extended commute times as workers seek affordable housing farther from job centers
- Political pressure for zoning reform and increased housing production
4. The Impact of Interest Rates
While home prices have remained elevated, mortgage rates averaging around 6.2% in early 2025 have improved from 2023 peaks above 7%. This has provided some relief to buyers, though monthly payments remain significantly higher than during the pandemic-era low-rate environment.
5. Emerging Affordable Markets
Beyond the traditional affordable markets, several cities are attracting attention for balancing affordability with growth potential:
- Indianapolis, IN – Growing tech sector, affordable housing
- Kansas City, MO – Strong economy, affordable homes under $335,000
- Oklahoma City, OK – Energy sector growth, median homes around $280,000
- Charlotte, NC – Banking hub with relatively moderate pricing
- Raleigh, NC – Research Triangle, strong job growth
What This Means for Homebuyers
Considerations for Prospective Buyers
If you’re priced out of coastal markets:
- Consider whether remote or hybrid work could allow relocation to more affordable markets
- Research growing secondary cities with strong job markets and cultural amenities
- Look at total cost of living, not just housing—lower taxes and living costs can offset income differences
If you’re in an affordable market:
- Take advantage of lower prices to build equity more quickly
- Consider investment properties or house hacking strategies
- Be aware that appreciation rates may be slower than in high-demand markets
Regardless of market:
- Get pre-approved for a mortgage to understand your budget
- Consider total homeownership costs including property taxes, insurance, and maintenance
- Work with a local real estate agent who understands market-specific dynamics
- Don’t overextend financially—aim for housing costs below 30% of gross income
Looking Ahead: 2026 and Beyond
Housing affordability will likely remain a central economic and political issue in 2026. Several factors will influence the market:
- Interest Rate Policy: Federal Reserve actions will continue to impact mortgage rates and buyer demand
- Housing Supply: New construction activity and zoning reforms could help moderate prices in supply-constrained markets
- Migration Patterns: Continued movement from expensive coastal cities to affordable inland markets may persist
- Economic Conditions: Job market strength, inflation, and wage growth will all affect affordability
- Policy Interventions: Federal, state, and local initiatives to address housing affordability may gain traction
The American housing market of 2026 presents a tale of two markets. For those willing and able to relocate to affordable regions—primarily in the Midwest and South—homeownership remains highly achievable. Cities like Detroit, Cleveland, and Pittsburgh offer not just affordable housing but also growing job markets, cultural amenities, and community pride.
Conversely, major coastal markets, particularly in California, have become increasingly inaccessible to middle-class families. Even with substantial incomes, homeownership in cities like Newport Beach, Santa Monica, or San Francisco requires extraordinary financial resources or family assistance.
For prospective homebuyers, the message is clear: geography matters immensely. The same income that struggles to afford a starter home in Los Angeles could purchase a substantial property in Indianapolis or St. Louis. As remote work opportunities continue to evolve, more Americans have the flexibility to choose affordability without sacrificing career prospects.
Whether you’re a first-time buyer, looking to relocate, or considering real estate investment, understanding these affordability dynamics is essential for making informed decisions in today’s complex housing market.
The Pandemic has upended the real estate market so far in unexpected and varied ways. Record low mortgage interest rates combined with people spending most of their time at home has caused a boom in home buying in many housing markets despite widespread unemployment.
Not only that, but people are moving and considering new locations. Office closures mean that many people are working from home and some employers have suggested this may be a permanent trend. All these trends are conspiring together to cause people to consider moving to new places across America.
Fair Use Statement
Information is power. Please share our content for editorial or discussion purposes. All we ask is that you link back to this page and give proper credit to our author.